引き続き、ゼロDの写経を続ける。今回は、学生の頃が懐かしい懐ワード、数値微分。
全然Deepに入れないけれどおっさんの復習。解析的な微分と数値微分が一致するところを確認してみる。
昔と違うのは、PythonとJupyterNotebookで超絶簡単に実験できるし、
こうやってWordPressでLaTeXで記事を書いたりできる点。
まず、微分の基本的な考え方は以下の通り。高校数学の数3の範囲。
\begin{eqnarray}
\frac{df(x)}{fx} = \lim_{h\rightarrow \infty} \frac{f(x+h)-f(x)}{h}
\end{eqnarray}
情報系学科に入って最初の方でEuler法とRunge-Kutta法を教わってコードを
書いたりレポート書いたりする。懐すぎる..。
または、基本情報の試験かなんかで、小さい値と小さい値どうしの計算で発生する問題が現れる。
ゼロDにはこの定義を少し改良した方法が載っている。へぇ。
\begin{eqnarray}
\frac{df(x)}{fx} = \lim_{h\rightarrow \infty} \frac{f(x+h)-f(x-h)}{2h}
\end{eqnarray}
写経なので、がんばって数値微分を書いて動かしてみる。
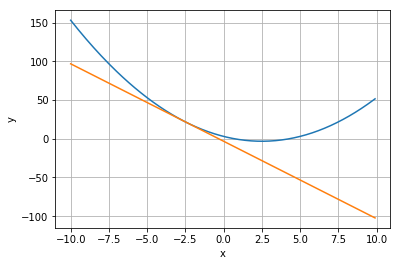
簡単な2次関数\(f(x)\)。
\begin{eqnarray}
f(x) &=& x^2 – 5x +3 \\
f'(x) &=& 2x – 5
\end{eqnarray}
def numerical_diff(f, x):
    h = 10e-4
    return (f(x+h) - f(x-h)) / (2*h)
\(f(x)\)と、\(x=2.5\)のところの\(f'(x)\)をmatplotlibで書いてみる。懐い…
import matplotlib.pyplot as plt
import numpy as np

def f(x):
    return x**2 - 5*x + 3

x = np.arange(-10, 10, 0.1)
y = f(x)
dy = numerical_diff(f,x)

plt.plot(x, y)

x1 = -2.5
dy1 = numerical_diff(f, x1)
y1 = f(x1) # y-y1 = dy1(x-x1) -> y = dy1(x-x1) + y1
j = lambda x: dy1 * (x-x1) + y1
plt.plot(x,j(x))

plt.xlabel('x')
plt.ylabel('y')
plt.grid()
plt.show()

偏微分
2変数以上の関数の数値微分は以下の通り。片方を止める。
数値微分の方法は上記と同じものを使った。
\begin{eqnarray}
\frac{\partial f(x_0,x_1)}{\partial x_0} &=& \lim_{h\rightarrow \infty} \frac{f(x_0 +h,x_1)-f(x_0-h,x_1)}{2h} \\
\frac{\partial f(x_0,x_1)}{\partial x_1} &=& \lim_{h\rightarrow \infty} \frac{f(x_0,x_1+h)-f(x_0,x_1-h)}{2h}
\end{eqnarray}
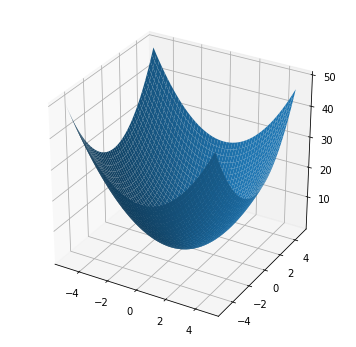
\((x_0,x_1)=(1,1)\)における\(x_0\)に対する偏微分\(\frac{\partial f(x_0,x_1)}{x_0}\)、\(x_1\)に対する偏微分\(\frac{\partial f(x_0,x_1)}{x_1}\)を求めてみる。
ちゃんと\(\frac{\partial f(x_0,1.0)}{x_0}=2.00..\)、\(\frac{\partial f(1.0,x_1)}{x_1}=2.00..\)になった。
import matplotlib.pyplot as plt
import numpy as np
from mpl_toolkits.mplot3d import Axes3D

def f(x):
    return x[0]**2 + x[1]**2

X = np.meshgrid(np.arange(-5., 5., 0.2),np.arange(-5., 5., 0.2))
Z = f(X)

fig = plt.figure(figsize=(6, 6))
axes = fig.add_subplot(111, projection='3d')
axes.plot_surface(X[0],X[1], Z)

f0 = lambda x: x**2 + 1.0**2
f1 = lambda x: 1.0**2 + x**2
df0 = numerical_diff(f0, 1.0)
df1 = numerical_diff(f1, 1.0)

print(df0)
# 2.0000000000000018
print(df1)
# 2.0000000000000018
plt.show()


