


If the sympathetic nervous system is stimulated, the points of restingHeartRate rise directly.I think “restingHeartRate” will reveal the index of relaxing myself.
Long term observation of restingHeartRate may specify mental or physical rhythms.
So, I scracthced the script to retrieve the long term “restingHeartRate” from the Fitbit Heartrate API to plot its trend.
The restingHeartRate itself may not be userful, but relatively useful
The point of restingHeartRate itself (75,82,..) may not be useful to observe the trend of individulas. The uptrend of restingHeartRate will warn that sympathetic nervous system is continuously stimulated, and show the necessity of resting, then avoid from streath.
So it’s important the standard of restingHeartRate and it’s important to relate the point and physical or mental conditions.
Index for rest
Vice versa, if this index get the uptrend, agressively rest.
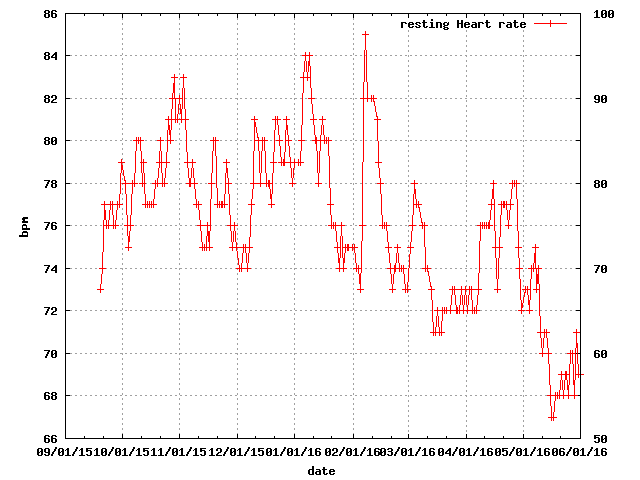
Plot example
As below, the x axis show the date, between 2015/08 and 2016/06, about 10months.
the y axis show the point of the restingHeartRate retrieved from Fitbit Heartrate api.